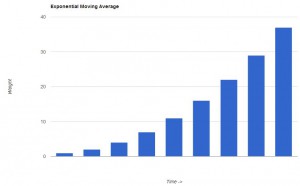
Exponential moving averages are similar to weighted moving averages in that they assign less weight to changes long ago, and more weight to recent changes. Weighted moving averages are linear, but exponential moving averages are exponential. That is, the weight can be expressed as a curve:

There is a great way to calculate exponential moving averages in T-SQL using an undocumented feature about variables and running totals in SQL Server. In this blog post I will show how to use that method to calculate exponential moving average in T-SQL, but I will also present a method that is using standard features in SQL Server. Unfortunately, that means using a loop.
In the examples I will calculate a 9 days exponential moving average. The examples use the database TAdb. A script to create TAdb can be found here.
Exponential Moving Average (EMA): Running Totals Method
The theory behind the running total features in updates is described in detail by Jeff Moden in his article Solving the Running Total and Ordinal Rank Problems.
Other resources that describe using this method to calculate EMA are the blog post Calculating Moving Averages with T-SQL by Gabriel Priester and the forum post Exponential Moving Average Challenge, both on SQL Server Central.
Basically, in T-SQL you can update variables as well as columns in an update statement. The updates are done row by row internally by SQL Server. This row by row behavior is what makes calculating a running total possible.
This example shows how it works:
DECLARE @TBL_RT TABLE
	(
		ColumnToSum INT,
		ColumnRunningTotal INT NULL
	)

INSERT @TBL_RT (ColumnToSum) VALUES (1),(2),(3)

DECLARE @varRunningTotal INT = 0

UPDATE
	@TBL_RT
SET
	@varRunningTotal = ColumnRunningTotal = ColumnToSum + @varRunningTotal

SELECT * FROM @TBL_RT
ColumnToSum ColumnRunningTotal
----------- ------------------
1           1
2           3
3           6
Note that “ColumnRunningTotal” is a running total of “ColumnToSum”.
Using this method we can calculate EMA9 with this T-SQL:
IF OBJECT_ID('tempdb..#TBL_EMA9_RT') IS NOT NULL BEGIN
	DROP TABLE #TBL_EMA9_RT
END

SELECT *, CAST(NULL AS FLOAT) AS EMA9 INTO #TBL_EMA9_RT FROM dbo.Quotes

CREATE UNIQUE CLUSTERED INDEX EMA9_IDX_RT ON #TBL_EMA9_RT (StockId, QuoteId)

IF OBJECT_ID('tempdb..#TBL_START_AVG') IS NOT NULL BEGIN
	DROP TABLE #TBL_START_AVG
END

SELECT StockId, AVG(QuoteClose) AS Start_Avg INTO #TBL_START_AVG FROM dbo.Quotes WHERE QuoteId <= 9 GROUP BY StockId

DECLARE @C FLOAT = 2.0 / (1 + 9), @EMA9 FLOAT

UPDATE
	T1
SET
	@EMA9 =
		CASE
			WHEN QuoteId = 9 then T2.Start_Avg
			WHEN QuoteId > 9 then T1.QuoteClose * @C + @EMA9 * (1 - @C)
		END
	,EMA9 = @EMA9
FROM
	#TBL_EMA9_RT T1
JOIN
	#TBL_START_AVG T2
ON
	T1.StockId = T2.StockId
OPTION (MAXDOP 1)

SELECT StockId, QuoteId, QuoteDay, QuoteClose, CAST(EMA9 AS NUMERIC(10,2)) AS EMA9 FROM #TBL_EMA9_RT

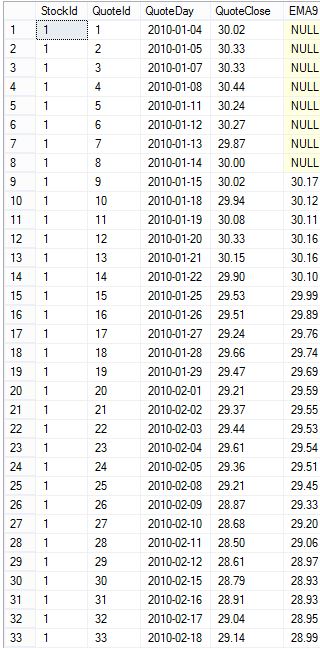
The calculation of EMA is rather simple. We use the current row and the previous, but with more weight to the current row. The weight is calculated by the formula 2/(1+9), where “9” is the parameter for the length of the EMA. To calculate EMA9 for row 10 above, the calculation is:
SELECT (29.94*2.0/(1+9)) + 30.17 * (1 - 2.0/(1+9))
30.124
In this case the current row gets 20% of the weight (2/(1+9)=0.2) and the previous row gets 80% of the weight (1-2/(1+9)=0.8).
You find this calculation in the statement above in the CASE statement:
WHEN QuoteId > 9 then T1.QuoteClose * @C + @EMA9 * (1 - @C)
Exponential Moving Average (EMA): Looping Method
As far as I know, except for the running totals method outlined above, there is no way to calculate EMA using a set based SQL statement. Therefore, the T-SQL below is using a while loop to calculate EMA9:
IF OBJECT_ID('tempdb..#TBL_EMA9_LOOP') IS NOT NULL BEGIN
	DROP TABLE #TBL_EMA9_LOOP
END

SELECT *, CAST(NULL AS FLOAT) AS EMA9 INTO #TBL_EMA9_LOOP FROM dbo.Quotes

CREATE UNIQUE CLUSTERED INDEX EMA9_IDX ON #TBL_EMA9_LOOP (StockId, QuoteId)

DECLARE @StockId INT = 1, @QuoteId INT, @QuoteIdMax INT, @StartAvg FLOAT, @C FLOAT = 2.0 / (1 + 9), @EMA9 FLOAT

WHILE @StockId <= 2 BEGIN
	SELECT @QuoteId = 1, @QuoteIdMax = MAX(QuoteId) FROM dbo.Quotes WHERE StockId = @StockId
	SELECT @StartAvg = AVG(QuoteClose) FROM dbo.Quotes WHERE StockId = @StockId AND QuoteId <= 9

	WHILE @QuoteId <= @QuoteIdMax BEGIN
			UPDATE
				T0
			SET
				EMA9 =
					CASE
						WHEN @QuoteId = 9 THEN @StartAvg
						WHEN @QuoteId > 9 THEN (T0.QuoteClose * @C) + T1.EMA9 * (1.0 - @C)
					END
			FROM
				#TBL_EMA9_LOOP T0
			JOIN
				#TBL_EMA9_LOOP T1
			ON
				T0.StockId = T1.StockId
			AND
				T0.QuoteId - 1 = T1.QuoteId
			WHERE
				T0.StockId = @StockId
			AND
				T0.QuoteId = @QuoteId

			SELECT @QuoteId = @QuoteId + 1
	END

	SELECT @StockId = @StockId + 1
END

SELECT StockId, QuoteId, QuoteDay, QuoteClose, CAST(EMA9 AS NUMERIC(10,2)) AS EMA9 FROM #TBL_EMA9_LOOP
The results are the same as in the running totals example above.
Performance
As expected, the set based running totals version is way faster than the loop version. On my machine the set based solution was about 300 ms, compared to about 1200 with the loop version. The loop version is more conforming to SQL standards however. So the choice between the methods depends on what’s most important for you, performance or standards.
Usage
The exponential moving average can be used in trend analysis, as with the other types of moving averages, Simple Moving Average (SMA) and Weighted moving average (WMA).
There are also other calculations in technical analysis that uses the EMA, MACD for instance.
[blue_box]This blog post is part of a serie about technical analysis, TA, in SQL Server. See the other posts here.[/blue_box]

Pingback: MACD in T-SQL | Tomas LindTomas Lind
Hi,
Found this very usefull. Is there a way to do an initial takeon and then only process the delta? So, I want to load 2000 days worth of history and then only load say the last 7 days worth of data and then only perfrom cals for the new data and merge\insert into my master table.
Cheers
Hi, that should be possible since the resulting EMA is stored in its own column.
Regards
Tomas
Nolan;
I the way I do it is kind of thinking outside the box. I calculate the 20 EMA’s over 7k stock tickers every day in about 15 minutes. I put the results on my website stocksreally.com. You don’t need a loop or anything…