
The dynamic management view sys.dm_exec_cached_plans returns information on query plans currently in memory. This information can be useful for a lot of reasons: checking total memory allowed for cached plans, which plans aren’t getting reused, searching for certain query plan operators (for instance, scans), which query plans are high memory consumers etc.
SQL Server stores compiled query plans in the memory cache, with the purpose of reusing the plans without the need for costly recompiles. So it is important that there is enough room in the cache. Plans that don’t get reused and plans that consume large amounts of memory should be investigated if you are experiencing many recompiles in your system.
Also, SQL Server provides access to the actual plan in XML format. This means we can monitor the plans in cache for certain operators. For instance, in an OLTP environment, you may not want table or index scans, or other join methods than loop joins (since other join types usually involves larger data sets).
Information returned from sys.dm_exec_cached_plans
A complete reference on the columns returned by sys.dm_exec_cached_plans can be found on TechNet.
When I queried the view on my laptop, I got the following result:
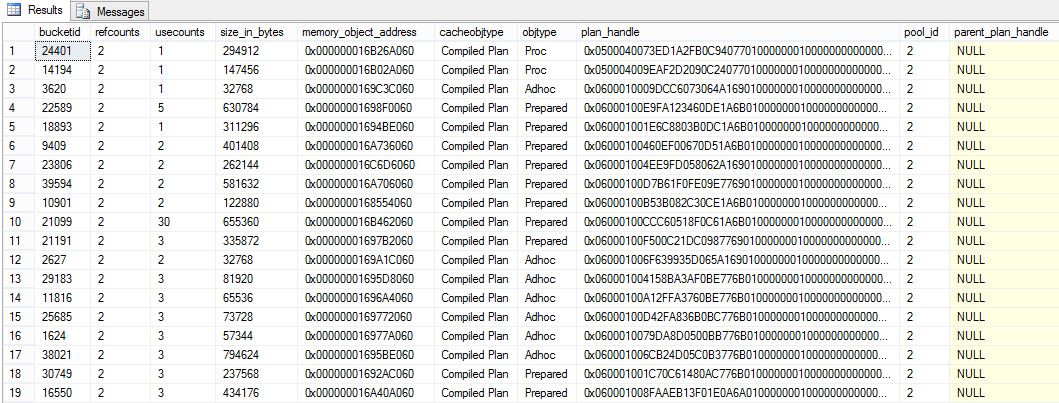
Some of the columns are:
usecounts
How many times have the plan been used?
size_in_bytes
How much space is required to store the plan in cache?
cacheobjtype
What type of cache object is it? Can be one of the following (from TechNet):
objtype
What type of object does the plan come from? Can be one of the following (from TechNet):
plan_handle
sys.dm_exec_cached_plans doesn’t contain the actual query plan. Instead it has a so called plan_handle, which is used as a link to the actual XML query plan, and the sql statement. Among others, the plan handle can be used in the following functions:
There is also the, sometimes useful, function sys.dm_exec_plan_attributes that lists lots of attributes saved with the query plan (see the list here). But I won’t be using this function any further here.
Alright, that is enough information to start building a more refined query returning plans from the cache. The query returns top 10 plans, which can be changed of course:
;WITH CTE_EQS AS
	(
		SELECT
			plan_handle
			,MAX(last_execution_time) AS last_execution_time
			,SUM(total_worker_time) / 1000000.00 AS total_worker_time_sec
			,MAX(max_worker_time) / 1000000.00 AS max_worker_time_sec
			,SUM(total_physical_reads) / 8 AS total_physical_reads_KB
			,MAX(max_physical_reads) / 8 AS max_physical_reads_KB
			,SUM(total_logical_writes) / 8 AS total_logical_writes_KB
			,MAX(max_logical_writes) / 8 AS max_logical_writes_KB
			,SUM(total_logical_reads) / 8 AS total_logical_reads_KB
			,MAX(max_logical_reads) / 8 AS max_logical_reads_KB
			,SUM(total_clr_time) / 1000000.00 AS total_clr_time_sec
			,MAX(max_clr_time) / 1000000.00 AS max_clr_time_sec
			,SUM(total_elapsed_time) / 1000000.00 AS total_elapsed_time_sec
			,MAX(max_elapsed_time) / 1000000.00 AS max_elapsed_time_sec
		FROM
			sys.dm_exec_query_stats
		GROUP BY
			plan_handle
	)
SELECT TOP 10
	DB_NAME(EST.dbid) AS database_name
	,ECP.objtype
	,OBJECT_NAME(EST.objectid) AS objectname
	,SUBSTRING(EST.text, 1, 100) AS query_text
	,EQP.query_plan
	,ECP.size_in_bytes / 1024 AS size_in_kilobytes
	,ECP.usecounts
	,EQS.last_execution_time

	,CAST(EQS.total_worker_time_sec AS NUMERIC(22,2)) AS total_worker_time_sec
	,CAST(EQS.max_worker_time_sec AS NUMERIC(22,2)) AS max_worker_time_sec
	,CAST(EQS.total_worker_time_sec / ECP.usecounts AS NUMERIC(22,2)) AS avg_worker_time_sec

	,EQS.total_physical_reads_KB
	,EQS.max_physical_reads_KB
	,EQS.total_physical_reads_KB / ECP.usecounts AS avg_physical_reads_KB

	,EQS.total_logical_writes_KB
	,EQS.max_logical_writes_KB
	,EQS.total_logical_writes_KB / ECP.usecounts AS avg_logical_writes_KB

	,EQS.total_logical_reads_KB
	,EQS.max_logical_reads_KB
	,EQS.total_logical_reads_KB / ECP.usecounts AS avg_logical_reads_KB

	,CAST(EQS.total_clr_time_sec AS NUMERIC(22,2)) AS total_clr_time_sec
	,CAST(EQS.max_clr_time_sec AS NUMERIC(22,2)) AS max_clr_time_sec
	,CAST(EQS.total_clr_time_sec / ECP.usecounts AS NUMERIC(22,2)) AS avg_clr_time_sec

	,CAST(EQS.total_elapsed_time_sec AS NUMERIC(22,2)) AS total_elapsed_time_sec
	,CAST(EQS.max_elapsed_time_sec AS NUMERIC(22,2)) AS max_elapsed_time_sec
	,CAST(EQS.total_elapsed_time_sec / ECP.usecounts AS NUMERIC(22,2)) AS avg_elapsed_time_sec
FROM
	sys.dm_exec_cached_plans ECP
CROSS APPLY
	sys.dm_exec_sql_text (ECP.plan_handle) EST
CROSS APPLY
	sys.dm_exec_query_plan (ECP.plan_handle) EQP
LEFT OUTER JOIN
	CTE_EQS EQS
ON
	ECP.plan_handle = EQS.plan_handle
WHERE
	DB_NAME(EST.dbid) = DB_NAME()
AND
	CAST(EQP.query_plan AS VARCHAR(MAX)) LIKE '%TableScan%'
ORDER BY
	avg_elapsed_time_sec DESC --Most CPU expensive
If the query takes a while to run, that is because the complete query plan is returned as XML.
The query above is filtered to show only plans that use a table scan, for demonstration purposes. Remove this filter if you want to query the whole query cache:
AND
	CAST(EQP.query_plan AS VARCHAR(MAX)) LIKE '%TableScan%'
The query is also sorted on avg_elapsed_time_sec so the 10 rows returned are the most expensive in average elapsed query time. You probably want to try sorting on other columns, see column explanation below.
database_name
The name of the database. As default, the query only returns objects in the current database. But the query can be run for the whole instance. To do that remove the DB_NAME(EST.dbid) = DB_NAME() filter. But note that if you do, object_name will be NULL for all other than the current database.
objtype
The type of object (see explanation above).
objectname
The name of the object.
query_text
Text of the SQL. Use a filter on this column if you want to search for plans that use a specific table for instance.
query_plan
The query plan as XML. Click on a row to view the query plan in Management Studio.
size_in_kilobytes
Size of the plan in cache. Check if there are any extremely large plans in cache. Especially those with usecount = 1 is of interest. Perhaps those queries could be run on some other server?
usecounts
The number of times the query plan have been used. The queries executed the most are probably good candidates for some extra attention when it comes to optimization. Unless they already are low resource consumers of course. It could also be interesting to check queries that have usecounts = 1. Those queries has not been reused, but they take up space in the cache. If there are many plans that are not reused, this could lead to more compilations since there won’t be room for all query plans. Pay extra attention to queries that have similar statements. It could be variants of the same query taking up a lot of space in the cache.
last_execution_time
The time when the plan last started executing.
worker_time_sec, total, max and avg
These columns show CPU time for the plan. Sorting on this column shows the most demanding plans CPU wise. If you are experiencing high CPU load on your server, sort on this column.
physical_reads_KB, total, max and avg
Shows the physical read from disk. On a system with lots of read from disk, more memory could help. For individual plans, check for scans (table and index scans). Avoiding scans can reduce reads from disk a lot.
logical_writes_KB, total, max and avg
Logical writes to memory for the query plan.
logical_reads_KB, total, max and avg
Logical reads from memory for the query plan. Similar to physical_reads, but this is from memory. Same thing here, avoid scans if possible.
clr_time_sec, total, max and avg
Time consumed by execution within the .NET framework.
elapsed_time_sec, total, max and avg
Shows elapsed time executing the plan. Queries that runs for a long time may cause blocking. If you are experiencing a lot of blocking in your application, check for high values in this column.
Note that for the measurements, there are also columns that show min value and the last value for the plan in the cache. I didn’t include them in the query above.
Finally, make sure to check this article for an in-depth coverage of query plan DMV’s.