QlikView is a data analysis tool from QlikTech. They call it Business Discovery, or self-service BI.
One of the strength of QlikView is that it is quick to set up and get started with QlikView in a proof of concept.
Here I’ll show how to load data from AdventureWorks2012 into QlikView and how to create a simple interactive chart in QlikView.
Download free version of QlikView
There is a free downloadable version of QlikView here (you’ll have to register).
Note that the free version means your QlikView application only will work on your computer, you won’t be able to share it with others:

Those are the only limitations in the personal edition however. There are no limitations in functionality, neither is it a time limited demo version. A Personal Edition FAQ can be found here.
Create a new QlikView application
After downloading and installing, open QlikView and select “File” -> “New” to see the “Select data source” window. That dialog is all about reading data from Excel files however. Since we are going to read from SQL Server, just click “Cancel”.
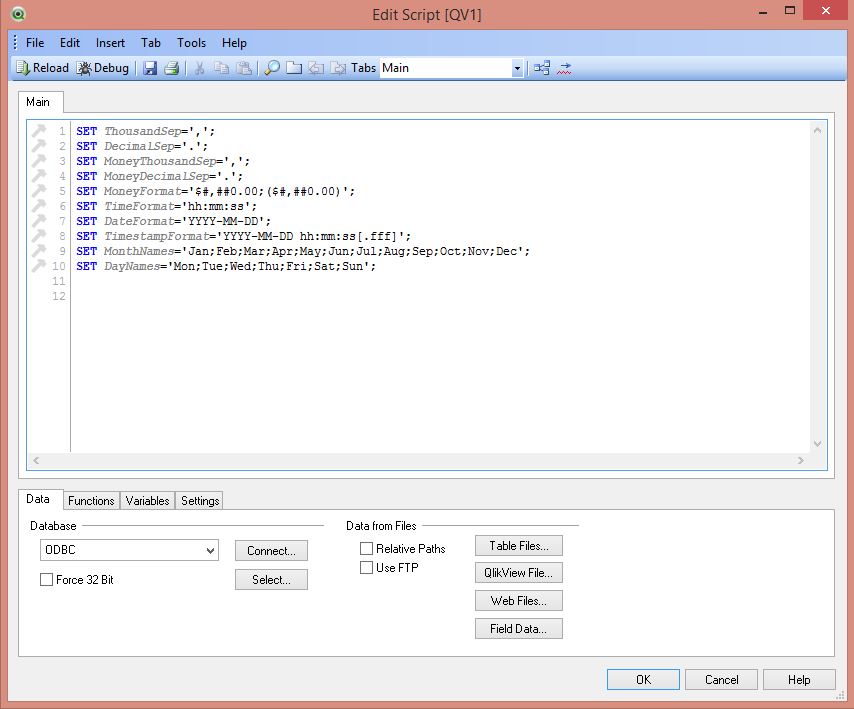
Instead select “File” -> “Edit Script”:
Create a connection from QlikView to SQL Server
First, we need a connection to our AdventureWorks2012 database. In the lower part of the script window, select “OLE DB”, and click “Connect”:

This will open the standard “Data Link Properties” window. Select “Microsoft OLE DB Provider for SQL Server” as provider, and click “Next”. Enter your server name, select NT Integrated security or specific user name, and lastly select the AdventureWorks2012 database:
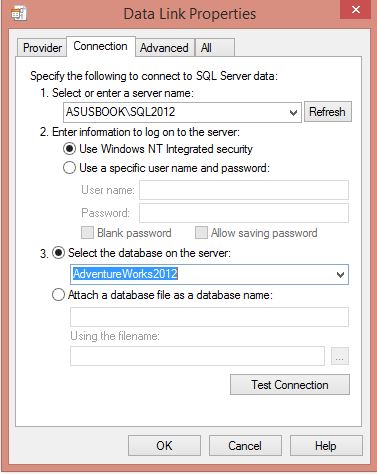
When you click “OK”, there will be a connection row created in the script, starting with “OLEDB CONNECT TO…”.
SQL statements in QlikView script to load data
If you prefer, you can use a wizard to select the views, tables and columns to include in the load script. If so, click the “Select” button in the lower part of the script window. However I’m simply going to create my sql statements in SSMS and then paste them into the script window. This way I will have code completion and other features of SSMS at disposal, which you won’t if you only use the QlikView script window.
One thing to note early on is that QlikView uses a natural join method to assume a connection/relation between tables. So if you have a fact table with a foreign key named ProductId, and a dimension table with the primary key column ProductId and ProductDesc, QlikView will automatically create a connection between the two tables. So in your analysis of the metrics in the fact table you’ll also have access to ProductDesc. Natural joins simply uses column names for “joins” which gives you control over this behaviour, you can always rename columns when needed. But when the script uses more tables, this is something you’ll have to pay attention to, since the model in QlikView can become complex and unpredictable when column names are repeated frequently. Pay special attention to generic column names such as “Name”, which can create… interesting results.
Basically, normal SQL is fine in the script window. There are a couple of differences however. Each “SELECT” statement must start with the keyword “SQL”. So “SELECT” simply becomes “SQL SELECT”. The other difference is that the “;” sign is mandatory as a separator between sql statements.
For demonstration purposes, I have created a really simple sql script that selects only some parts of the AdventureWorks2012 database. Basically, a fact table and three dimension tables. The sql statements that you can paste into the QlikView script window looks like this (don’t paste over the connection string):
SQL SELECT
	OrderDate
	,Status
	,OnlineOrderFlag
	,SalesPersonID
	,TerritoryID
	,ShipMethodID
	,SubTotal
	,TaxAmt
	,Freight
	,TotalDue
 FROM
	Sales.SalesOrderHeader;

SQL SELECT
	BusinessEntityID AS SalesPersonID
	,FirstName + ' ' + LastName AS SalesPersonName
FROM
	Person.Person;

SQL SELECT
	TerritoryID
	,[Group] as TerritoryGroup
	,[Name] as TerritoryName
FROM
	Sales.SalesTerritory;

SQL SELECT
	ShipMethodID
	,[Name] as ShipMethodName
FROM
	Purchasing.ShipMethod;
That’s all we need to load the QlikView application with data. Hit the “Reload” button in the upper left corner of the window. You will be prompted to save the application, do so at your preferred location. QlikView will now load the data from the sql statements and store the data locally in the application file. (There is not much data, so the load will probably be very fast.)
As noted, all the data is saved locally in the QlikView application file. That means once you have loaded the application, you don’t need the connection to the database anymore, except for refreshing the data. This also means that you need to apply some sort of security to the QlikView file (and in the QlikView application). There is also a client server version of QlikView that I strongly recommend.
The QlikView Table Viewer
When QlikView has finished loading the data, it will have created a data model over the loaded data. Click “File” -> “Table Viewer”:
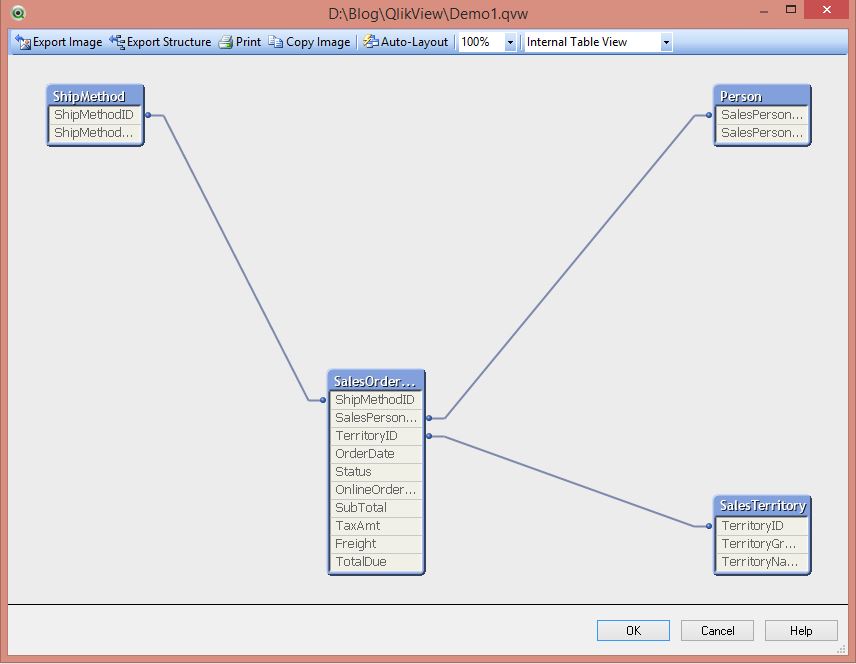
Here you can see how QlikView creates connections between columns, and spot any problems with the model such as loops or incorrect joins that I wrote about earlier.
Analysing data in QlikView with charts
The next step is to start analysing the data with charts or other visualizations. This can also act as a natural boundary between responsibilities. A developer (you) makes sure the data is loaded correctly into the QlikView application. Someone else, probably not from the IT department but rather a business analyst, creates the data visualizations and reports.
After QlikView has finished loading the data, a “Sheet Properties” window will show. Cancel that window for now.
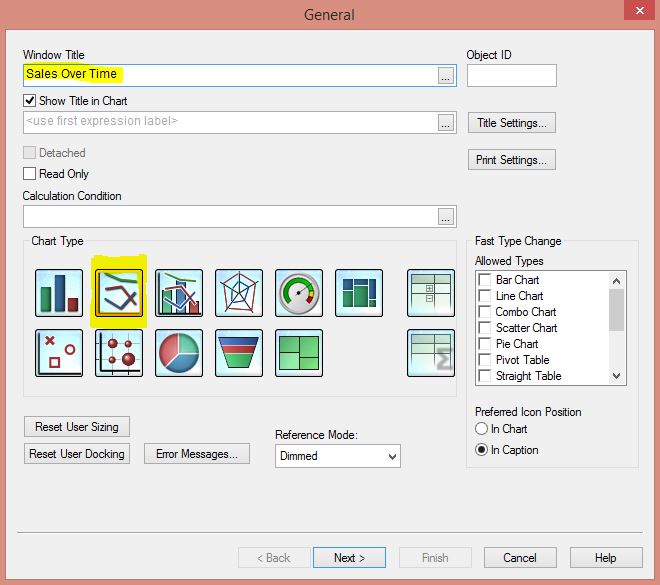
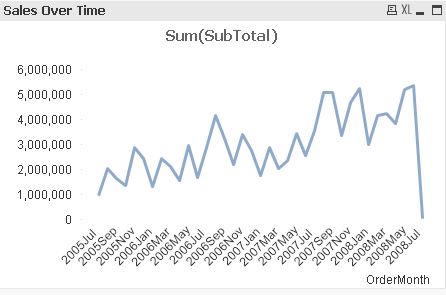
We now have an empty QlikView application. The data is loaded but there is no visualisations of it yet. Right click anywhere on the empty sheet and select “New Sheet Object” -> “Chart”. We are going to create a line chart showing sales over time. In the “General” window that appears, type “Sales Over Time” as window title, and select “Line Chart” as “Chart Type”:
Click “Next”. In the “Dimensions” window, we are going to use Order Date but we will summarize per month to get less detail in the chart. Click on the “Add Calculated Dimension” button. In the expression window that opens, type “=Year(OrderDate) & Month(OrderDate)”:
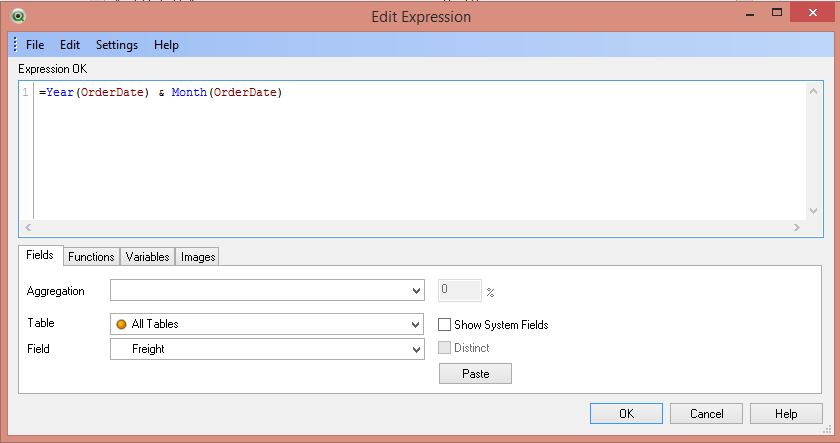
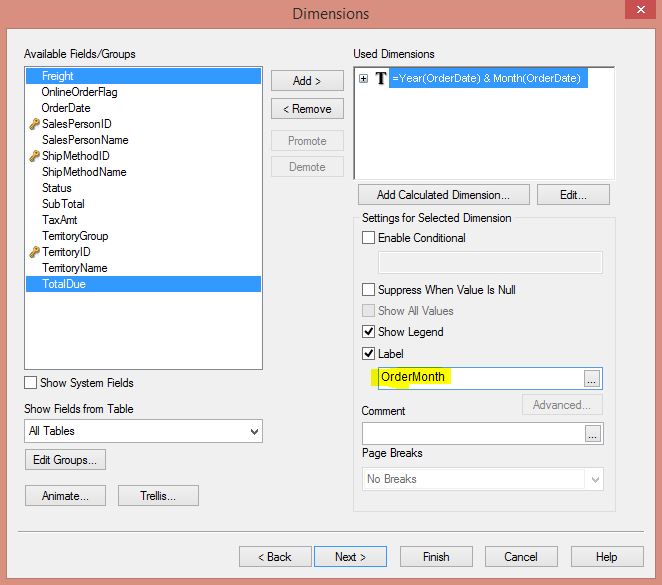
Click “OK”. Our newly created dimension will need to have a name (otherwise the calculation expression will show up as the name in charts). Type “OrderMonth” in the “Label” textbox:
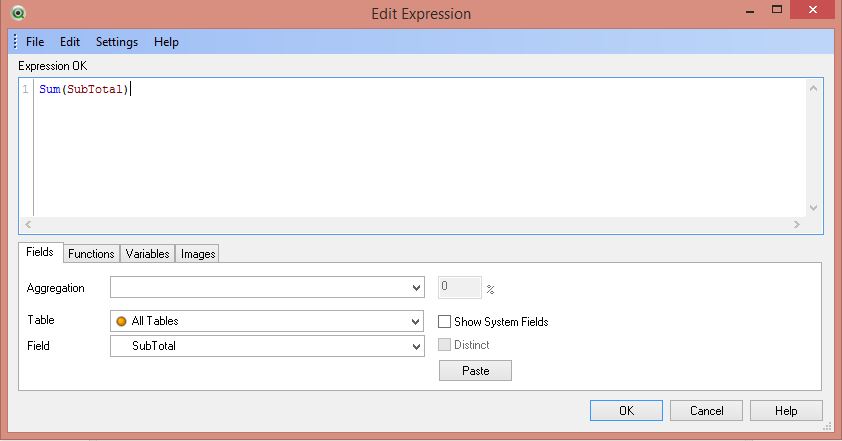
Click “Next”. This will bring up the “Edit Expression” window. Here we will set what is measured, in this case it is the sum of sales. Type Sum(SubTotal) in the expression window:
Click “OK”, and “Next” on the “Expressions” window. Click “Next” on the “Sort”, “Style” and “Presentation” windows.
You should now be on the “Axis” window. Select the sloping text orientation for the “Primary Dimension Labels”:
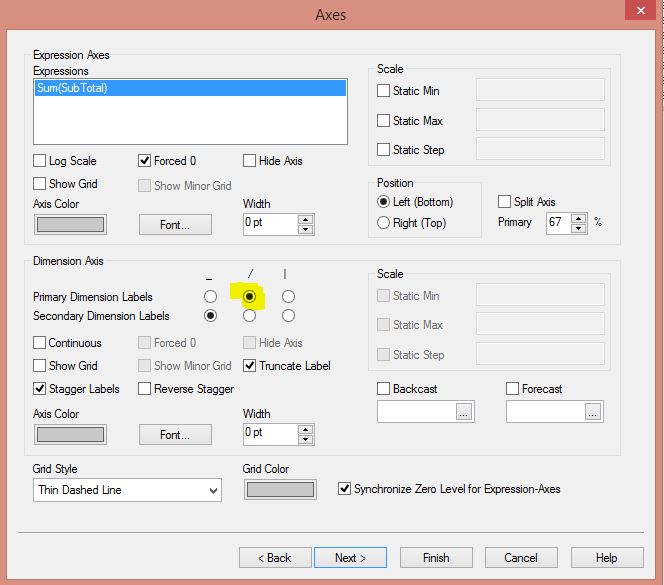
As you can see there are a lot of settings that we have skipped, but in this demonstration, click “Finish”.
You should now have a chart that looks something like this:
If you like you can drag in the corners of the chart to expand the size.
Click and drag anywhere in the chart to zoom in. What happens when you do that is that you filter the data along the dimension (OrderMonth in this case). Anytime you have created a filter, use the buttons in the menu bar to go back or clear all filters:

Other dimension exploring options in QlikView
Next, we are going to add a so called “Multi Box” which is used to further enhance our analysis. Right click on the sheet add select “New Sheet Object” -> “Multi Box”. This opens the “New multibox” window. Add TerritoryGroup, TerritoryName and SalesPersonName:
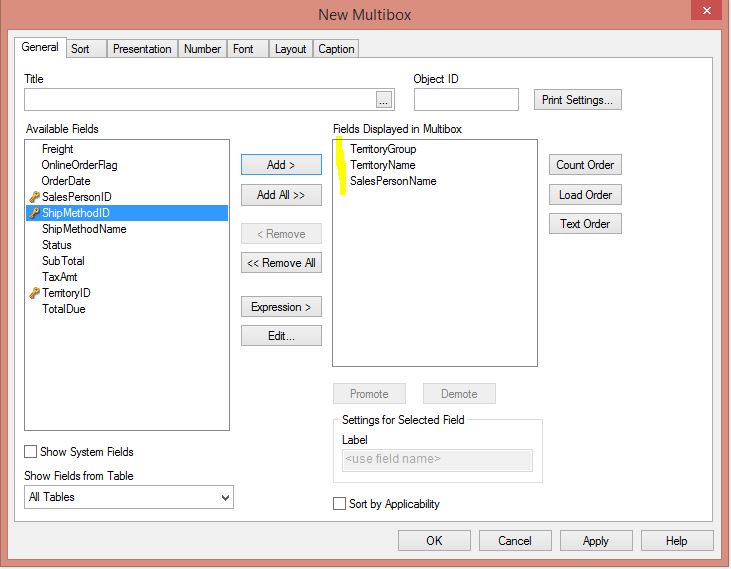
Click “OK”. If you select North America in the multibox, you’ll see that the chart gets filtered on North America only. The other fields in the multibox are filtered as well. If you check the values in TerritoryName, you’ll see that the valid values for North America have a white background but the not valid values are greyed out (Australia and so forth). Same thing with the SalesPersonName. Only sales persons active in North America have the white background:
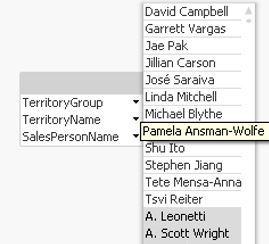
As you can see, by using interactive charts and other dimension exploring tools, QlikView can be a very powerful tool in a “Business Discovery” process.
This is just a very short introduction aimed to cover the basics, there are tons of other tools and functions in QlikView not mentioned here. But since you now have the QlikView Personal Edition, you can explore the other features on your own 🙂