
The default setting in SQL Server 2005 and later is to keep a trace running all the time that captures basic information about the instance. This is called the Default Trace. The created trace files can be viewed in Performance Monitor or by using T-SQL and they can be very useful in some troubleshooting scenarios.
SQL Server keeps the trace history in five log files. Each log file can be up to 20 Mb. So there is no way of knowing how long each trace event will stay in the log files before deletion. It depends of how many events the instance is generating.
To check if the default trace is enabled, use:
SELECT value_in_use FROM sys.configurations WHERE NAME = 'default trace enabled'
To enable or disable the default trace, use:
sp_configure 'show advanced options', 1;
GO
RECONFIGURE;
GO
sp_configure 'default trace enabled', 1;
GO
RECONFIGURE;
GO
The trace is light weight, so I recommend keeping it running unless you suspect you’d get some performance benefits from disabling it.
To see where SQL Server keeps the trace files, use:
SELECT [path] FROM sys.traces WHERE is_default = 1
That statement will show the current trace file that SQL Server is logging to.
View the default trace in SQL Server Profiler
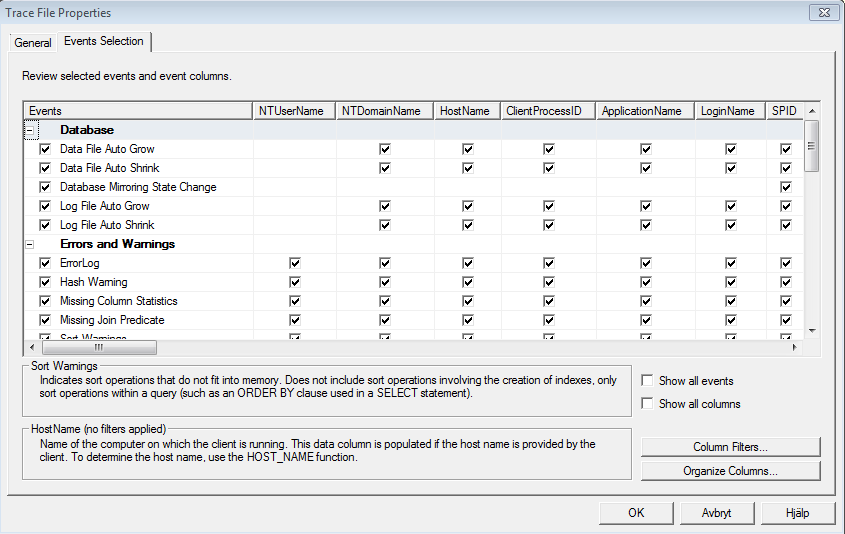
The trace files can be opened and viewed like any other trace file with SQL Server Profiler. Profiler can also be used to see the events that are collected. Select File -> Properties and the Events Selection tab:
[blue_box]
The following list shows the events that are captured by the default trace. The descriptions are from MSDN. There are traces in the following categories: Database, Errors and Warnings, Objects, Performance, Security Audit, Server and Full text. The list is based on a SQL Server 2014 instance:
Database
92 – Data File Auto Grow
Indicates that a data file was extended automatically by the server.
93 – Log File Auto Grow
Indicates that a log file was extended automatically by the server.
94 – Data File Auto Shrink
Indicates that a data file was shrunk automatically by the server.
95 – Log File Auto Shrink
Indicates that a log file was shrunk automatically by the server.
167 – Database Mirroring State Change
Occurs when the state of a mirrored database changes.
Errors and Warnings
22 – ErrorLog
Indicates that error events have been logged in the SQL Server error log.
55 – Hash Warning
Indicates that a hashing operation (for example, hash join, hash aggregate, hash union, and hash distinct) that is not processing on a buffer partition has reverted to an alternate plan. This can occur because of recursion depth, data skew, trace flags, or bit counting.
69 – Sort Warnings
Indicates sort operations that do not fit into memory. Does not include sort operations involving the creating of indexes; only sort operations within a query (such as an ORDER BY clause used in a SELECT statement).
79 – Missing Column Statistics
Column statistics that could have been useful for the optimizer are not available.
80 – Missing Join Predicate
Query that has no join predicate is being executed. This could result in a long-running query.
Objects
46 – Object:Created
Indicates that an object has been created, such as for CREATE INDEX, CREATE TABLE, and CREATE DATABASE statements.
47 – Object:Deleted
Indicates that an object has been deleted, such as in DROP INDEX and DROP TABLE statements.
164 – Object:Altered
Occurs when a database object is altered.
Performance
218 – Plan Guide Unsuccessful
Indicates that SQL Server could not produce an execution plan for a query or batch that contained a plan guide. SQL Server attempted to generate an execution plan for this query or batch without applying the plan guide. An invalid plan guide may be the cause of this problem. You can validate the plan guide by using the sys.fn_validate_plan_guide system function.
Security Audit
18 – Audit Server Starts and Stops
Occurs when the SQL Server service state is modified.
20 – Audit Login Failed
Indicates that a login attempt to SQL Server from a client failed.
102 – Audit Database Scope GDR
Occurs every time a GRANT, DENY, REVOKE for a statement permission is issued by any user in SQL Server for database-only actions such as granting permissions on a database.
103 – Audit Object GDR Event
Occurs every time a GRANT, DENY, REVOKE for an object permission is issued by any user in SQL Server.
104 – Audit AddLogin Event
Occurs when a SQL Server login is added or removed; for sp_addlogin and sp_droplogin.
105 – Audit Login GDR Event
Occurs when a Windows login right is added or removed; for sp_grantlogin, sp_revokelogin, and sp_denylogin.
106 – Audit Login Change Property Event
Occurs when a property of a login, except passwords, is modified; for sp_defaultdb and sp_defaultlanguage.
108 – Audit Add Login to Server Role Event
Occurs when a login is added or removed from a fixed server role; for sp_addsrvrolemember, and sp_dropsrvrolemember.
109 – Audit Add DB User Event
Occurs when a login is added or removed as a database user (Windows or SQL Server) to a database; for sp_grantdbaccess, sp_revokedbaccess, sp_adduser, and sp_dropuser.
110 – Audit Add Member to DB Role Event
Occurs when a login is added or removed as a database user (fixed or user-defined) to a database; for sp_addrolemember, sp_droprolemember, and sp_changegroup.
111 – Audit Add Role Event
Occurs when a login is added or removed as a database user to a database; for sp_addrole and sp_droprole.
115 – Audit Backup/Restore Event
Occurs when a BACKUP or RESTORE command is issued.
116 – Audit DBCC Event
Occurs when DBCC commands are issued.
117 – Audit Change Audit Event
Occurs when audit trace modifications are made.
152 – Audit Change Database Owner
Occurs when ALTER AUTHORIZATION is used to change the owner of a database and permissions are checked to do that.
153 – Audit Schema Object Take Ownership Event
Occurs when ALTER AUTHORIZATION is used to assign an owner to an object and permissions are checked to do that.
175 – Audit Server Alter Trace Event
Occurs when a statement checks for the ALTER TRACE permission.
Server
81 – Server Memory Change
SQL Server memory usage has increased or decreased by either 1 megabyte (MB) or 5 percent of the maximum server memory, whichever is greater.
Full text
155 – FT:Crawl Started
Occurs when a full-text crawl (population) starts. Use to check if a crawl request is picked up by worker tasks.
156 – FT:Crawl Stopped
Occurs when a full-text crawl (population) stops. Stops occur when a crawl completes successfully or when a fatal error occurs.
To get the list above with T-SQL, use:
SELECT
	TC.name AS Category
	,TE.trace_event_id as EventId
	,TE.name as [Event]
FROM
	sys.trace_events AS TE
JOIN
	sys.trace_categories AS TC
ON
	TE.category_id = TC.category_id
WHERE
	TE.trace_event_id IN (18,20,22,46,47,55,69,79,80,81,92,93,94,95,102,103,104,105,106,108,109,110,111,115,116,117,152,153,155,156,164,167,175,218)
ORDER BY
	TC.category_id
	,TE.trace_event_id
[/blue_box]
View the default trace with T-SQL
The trace files can also be queried with T-SQL, using the system table sys.fn_trace_gettable. This detailed blog post shows how to query all the log trace files at once.
SELECT TOP 100
	TC.name AS TraceCategoryName
	,TE.name as TraceEventName
	,TCV.subclass_name
	,TRC.*
FROM
	::fn_trace_gettable((SELECT LEFT([path], LEN([path]) - PATINDEX('%\%', REVERSE([path]))) + '\log.trc' FROM sys.traces WHERE is_default = 1), DEFAULT) AS TRC
JOIN
	sys.trace_events AS TE
ON
	TRC.EventClass = TE.trace_event_id
JOIN
	sys.trace_categories AS TC
ON
	TE.category_id = TC.category_id
LEFT OUTER JOIN
	sys.trace_subclass_values AS TCV
ON
	TE.trace_event_id = TCV.trace_event_id
AND
	TRC.EventSubClass = TCV.subclass_value
The content varies depending on the type of event, but some general columns are:
Event Class
This is the event identifier, as in the list above. For instance, 69 for a sort warning. The complete list of events can be found in the system table sys.trace_events.
Trace Category
Events can be further grouped into trace categories that can be found in sys.trace_categories. This is the same as the headers in the list above. For instance, a 69 – Sort Warning belongs to the category Errors and Warnings.
Event Sub Class
Events can be further divided into sub classes (for instance drop or create) that can be found in the system table sys.trace_subclass_values.
Object Type
The column ObjectType refers to a list of object types. They are not available in SQL Server (that I know of), but the list can be found at MSDN.