
On a machine running SQL Server there are a lot of performance counters that can be used to create baselines or to investigate performance problems. Those specific to SQL Server can be sampled regularly from the system table sys.dm_os_performance_counters. But those belonging to the OS must be gathered in some other way. Since I’m a SQL Server DBA, of course I want the counters saved to a table in SQL Server 🙂
The command line tool Typeperf can be used to log performance monitor counters to different targets, one of those beeing SQL Server. This great article covers it all, showing in detail how to get performance monitor counters into SQL Server.
In this blog post, I just want to sum up the basic steps and add some points about scheduling. For a more detailed description, check out the article Collecting Performance Data into a SQL Server Table.
Create the PerfMon database
Typeperf will automatically create the necessary tables to log to, but the database must already exist. Create a database named PerfMon. I suggest that you use simple recovery model.
Create an ODBC connection
Typeperf only uses ODBC to connect to databases, so create a System DSN named PerfMonDS.
Create a PerfMonConfig file
The list of counters that will be sampled must be saved in a text file. Create the text file C:\PerfMon\PerfmonCounters.txt with the following content:
\Memory\Available MBytes
\Paging File(_Total)\% Usage
\PhysicalDisk(* *)\Avg. Disk Queue Length
\PhysicalDisk(* *)\Avg. Disk sec/Read
\PhysicalDisk(* *)\Disk Read Bytes/sec
\PhysicalDisk(* *)\Avg. Disk sec/Write
\PhysicalDisk(* *)\Disk Write Bytes/sec
\Processor(*)\% Processor Time
\System\Processor Queue Length
It is up to you to decide what counters to sample, but those above are the ones I usually start with, assuming you already collect the SQL Server specific counters somewhere else. You could also add SQL counters to the list above if you like.
Tip: to see a list of all available counters, type TYPEPERF -q at the command prompt.
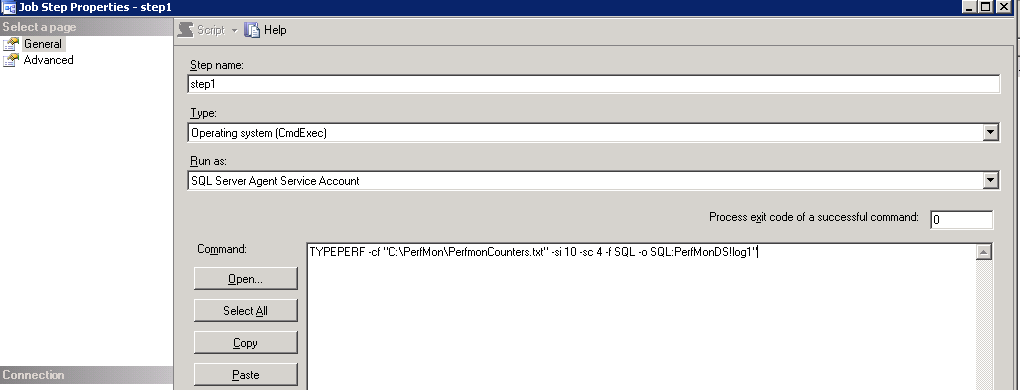
Create a SQL Agent job – PerfMon
The following command line command is used to start the sampling:
TYPEPERF -cf "C:\PerfMon\PerfmonCounters.txt" -si 10 -sc 4 -f SQL -o SQL:PerfMonDS!log1"
-cf points to the file with counters.
-si is the sampling interval, in the example above it is every 10 seconds. Default is 1.
-sc is how many samples will be taken. The process shuts down when this many samples have been collected. Default is to run until stopped somehow.
-f is the output file format. In the example above it is the ODBC connection created earlier. The !log1 is not a typo, leave it like that. (Read more about collection sets in the article mentioned above.)
Create a SQL Agent job named PerfMon with a job step running the operating system command above:
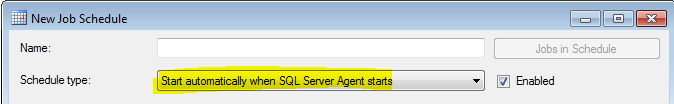
Create a schedule for the job if you like. For instance, you can make the job start whenever SQL Agent starts:
If you skip the -sc parameter, the job will run until stopped.
Create a SQL Agent job – PerfMonPurge
The TYPEPERF process can gather huge amounts of data if you’re not careful. Make sure not to sample too often and to not run the job longer than necessary. As a way to keep the table size down, create a SQL Agent job that deletes samples older than a specified number of hours. Use the following SQL template:
DELETE FROM PerfMon.dbo.CounterData WHERE CONVERT(DATETIME,SUBSTRING(CounterDateTime,0,20)) < DATEADD(HH, -24, GETDATE())
This will delete samples older than 24 hours.
The number of rows in the dbo.CounterData depends on the machine it is running on. A lot of CPU cores and lots of disks will create more counters. Running the above on my laptop with two disks and one core for one hour resulted in 7180 rows.
How to collect at specific times
If you want to set up a collection of counters, say for 1 hour every day; create a SQL Agent job that starts TYPEPERF at the desired time. Secondly, you need to use the -sc parameter to limit the number of samples. If you sample every 10 seconds (the -si parameter), and you want to run for an hour that is: 6 per minute * 60 minutes = 360 samples.
Querying the counters
The following T-SQL can be used as a template to query the counters. It creates Max, Min and Avg aggregates per minute:
SELECT
	C.MachineName
	,C.ObjectName
	,C.CounterName
	,C.CounterType
	,C.DefaultScale
	,C.InstanceName
	,CONVERT(DATETIME,SUBSTRING(D.CounterDateTime,0,16))  AS CounterMinute
	,MAX(D.CounterValue) AS MaxValue
	,MIN(D.CounterValue) AS MinValue
	,AVG(D.CounterValue) AS AvgValue
FROM
	dbo.CounterDetails AS C
JOIN
	dbo.CounterData AS D
ON
	C.CounterID = D.CounterID
GROUP BY
	C.MachineName
	,C.ObjectName
	,C.CounterName
	,C.CounterType
	,C.DefaultScale
	,C.InstanceName
	,CONVERT(DATETIME,SUBSTRING(D.CounterDateTime,0,16))
[blue_box]
TechNet has a list of all the windows performance counters. From that list on the counters used above:
Memory\Available MBytes
Shows the amount of physical memory, in Megabytes, immediately available for allocation to a process or for system use. It is equal to the sum of memory assigned to the standby (cached), free, and zero page lists.
Paging File\% Usage
Shows the greatest percentage of the paging file that was in use during the sample interval.
PhysicalDisk\Avg. Disk Queue Length
Shows the average number of both read and write requests that were queued for the selected disk during the sample interval.
PhysicalDisk\Avg. Disk sec/Read
Shows the average time, in seconds, of a read of data from the disk.
PhysicalDisk\Disk Read Bytes/sec
Shows the rate, in incidents per second, at which bytes were transferred from the disk during read operations.
PhysicalDisk\Avg. Disk sec/Write
Shows the average time, in seconds, of a write of data to the disk.
PhysicalDisk\Disk Write Bytes/sec
Shows the rate, in incidents per second, at which bytes were transferred to the disk during write operations.
Processor\% Processor Time
Shows the percentage of elapsed time that this thread used the processor to execute instructions. An instruction is the basic unit of execution in a processor, and a thread is the object that executes instructions. Code executed to handle some hardware interrupts and trap conditions is included in this count.
System\Processor Queue Length
Shows the number of threads in the processor queue. Unlike the disk counters, this counter shows ready threads only, not threads that are running. There is a single queue for processor time, even on computers with multiple processors. Therefore, if a computer has multiple processors, you need to divide this value by the number of processors servicing the workload. A sustained processor queue of greater than two threads generally indicates processor congestion.
[/blue_box]
Hi, I liked your post. However there is a small mistake in the SQL script.
SUBSTRING(D.CounterDateTime,0,16)) will not display correct time. When you change it to SUBSTRING(D.CounterDateTime,0,17)) it will work better.