
When SQL Server evaluates if an index should be used to retrieve data in a query, selectivity is one of the most important factors. Of course, given that the index column matches the filter or join columns.
If a column only has one or very few unique values, index selectivity is low. True/false columns and gender is common examples.
If there are only unique values in a column, index selectivity is high. Primary keys meets these requirements as they are always unique.
SQL Server favors indexes that are built on columns with high selectivity, since this may return fewer rows and therefore at a lower cost.
If the index has multiple columns, it is preferable (if possible) that the columns are in the order of their selectivity (most selective first).
So how is selectivity computed?
Computing Index Selectivity
To get the total selectivity for a column, use the calculation [NO_UNIQUE_VALUES] / [TOTAL_NO_ROWS]. If the column only has unique values, the selectivity is 1 since the number of unique values are the same as the total number of rows. If the column only has one value, the selectivity approaches 0. The exact value depends on total number of rows.
Let’s illustrate this with an example. In the script below is a sample database with a self-explaining orders table:
CREATE DATABASE SELECTIVITY
GO

USE SELECTIVITY
GO

CREATE TABLE dbo.ORDERS
	(
		ORDERID INT IDENTITY(1,1) CONSTRAINT ORDERID_PK PRIMARY KEY CLUSTERED
		,ORDERDATE DATE NOT NULL
		,AMOUNT INT NOT NULL
		,CUSTOMERID SMALLINT NOT NULL
		,COUNTRYID SMALLINT NOT NULL
	)
GO

INSERT dbo.ORDERS (ORDERDATE, AMOUNT, CUSTOMERID, COUNTRYID) VALUES
('2013-10-01', 100, 1, 1)
,('2013-10-02', 800, 1, 1)
,('2013-10-03', 10, 1, 1)
,('2013-10-04', 88, 1, 1)
,('2013-10-05', 999, 1, 1)
,('2013-10-06', 70, 1, 1)
,('2013-10-29', 101, 1, 1)
,('2013-10-15', 300, 1, 1)
,('2013-10-02', 55, 2, 1)
,('2013-10-14', 87, 3, 1)
,('2013-10-11', 11, 4, 1)
GO

SELECT
	'ORDERID' AS INDEXCOLUMN
	,COUNT(DISTINCT ORDERID) AS NO_UNIQUE_VALUES
	,COUNT(*) AS NO_ROWS
	,CAST(COUNT(DISTINCT ORDERID) AS FLOAT) / COUNT(*) AS SELECTIVITY
FROM
	dbo.ORDERS
UNION ALL
SELECT
	'CUSTOMERID' AS INDEXCOLUMN
	,COUNT(DISTINCT CUSTOMERID) AS NO_UNIQUE_VALUES
	,COUNT(*) AS NO_ROWS
	,CAST(COUNT(DISTINCT CUSTOMERID) AS FLOAT) / COUNT(*) AS SELECTIVITY
FROM
	dbo.ORDERS
UNION ALL
SELECT
	'ORDERDATE' AS INDEXCOLUMN
	,COUNT(DISTINCT ORDERDATE) AS NO_UNIQUE_VALUES
	,COUNT(*) AS NO_ROWS
	,CAST(COUNT(DISTINCT ORDERDATE) AS FLOAT) / COUNT(*) AS SELECTIVITY
FROM
	dbo.ORDERS
UNION ALL
SELECT
	'COUNTRYID' AS INDEXCOLUMN
	,COUNT(DISTINCT COUNTRYID) AS NO_UNIQUE_VALUES
	,COUNT(*) AS NO_ROWS
	,CAST(COUNT(DISTINCT COUNTRYID) AS FLOAT) / COUNT(*) AS SELECTIVITY
FROM
	dbo.ORDERS
GO
If you run it, the following is the output:
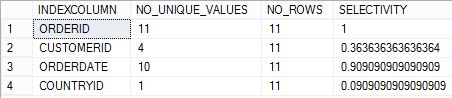
As expected, the clustered primary key column (ORDERID) has a selectivity of 1. However, in the other “end” we have the COUNTRYID column with a selectivity of only 0.09. All customers are from the same country, so the selectivity approaches 0. An index on this column only would be pointless. In between, we have CUSTOMERID and ORDERDATE with different selectivity, included as illustration.
Second hand information, which I haven’t confirmed, is that SQL Server will ignore indexes with an index selectivity of less than 0.85 and do a scan instead. If that’s the case, of the columns in the example, only ORDERID and ORDERDATE are suitable index candidates.
Data Skew
There is one more thing worth noting on selectivity. If the column is only moderately selective, the reason may be something called data skew. This happens when the data in the column is distributed unevenly, that is, a few values are repeated many times and other values are repeated a few times. Check the CUSTOMERID in the example above. 8 out of 11 orders are from the same customer (CUSTOMERID=1). Obviously, the index would be more useful when the predicate is on any other value that 1.
SQL Server creates statistical histograms on the distribution of data on indexes, which is used to check for data skew. With the histogram, the selectivity for the actual predicate value can be checked. If the CUSTOMERID is 1 the selectivity is low, but any other value means higher selectivity. Statistics and histograms deserves an own blog post however 🙂
Filtered indexes may be helpful when dealing with data skew. A filter that excludes all NULL values is common for instance.
Just remember that counting unique values in a column may be resource consuming, so be careful not to calculate selectivity on a production server.