Bollinger Bands® is a technical analysis tool trademarked by its inventor, John Bollinger. The basis for the bands is a simple moving average (SMA). Standard deviation lines are calculated above and under this moving average. Those lines are the Bollinger Bands.
The bands illustrate volatility, since they move apart when there are large movments (volatility) in a stock price, and they move together when there are small movements. The stock price movements within these bands are then used as indicators in trading.
This blog post will show how to calculate Bollinger Bands in T-SQL. This calculation will only work on SQL Server 2012 and later.
The examples use the database TAdb. A script to create TAdb can be found here.
The calculations for the bands are:
Upper Bollinger = MA20 + (STDEV Prices 20 periods * 2)
Lower Bollinger = MA20 – (STDEV Prices 20 periods * 2)
A normal length for the moving average is 20 periods, but both the length and the multiplier (2 above) can be changed. There are also variations in the type of moving average used, a weighted moving average can also be used.
Both the moving average and the standard deviation can be calculated with T-SQL window functions:
SELECT
    T0.StockId
    ,T0.QuoteId
    ,T0.QuoteDay
    ,T0.QuoteClose
    ,AVG(T0.QuoteClose) OVER (PARTITION BY T0.StockId ORDER BY T0.QuoteId ROWS 19 PRECEDING) AS MA20
	,AVG(T0.QuoteClose) OVER (PARTITION BY T0.StockId ORDER BY T0.QuoteId ROWS 19 PRECEDING)
		+ (STDEV(T0.QuoteClose) OVER (PARTITION BY T0.StockId ORDER BY T0.QuoteId ROWS 19 PRECEDING) * 2) AS UpperBollinger
	,AVG(T0.QuoteClose) OVER (PARTITION BY T0.StockId ORDER BY T0.QuoteId ROWS 19 PRECEDING)
		- (STDEV(T0.QuoteClose) OVER (PARTITION BY T0.StockId ORDER BY T0.QuoteId ROWS 19 PRECEDING) * 2) AS LowerBollinger
FROM
    dbo.Quotes AS T0
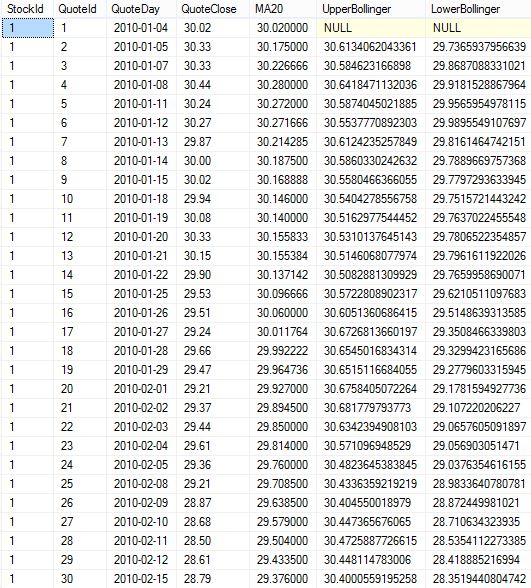
A sample from the results is included below:
The same information shown in a chart look like this:
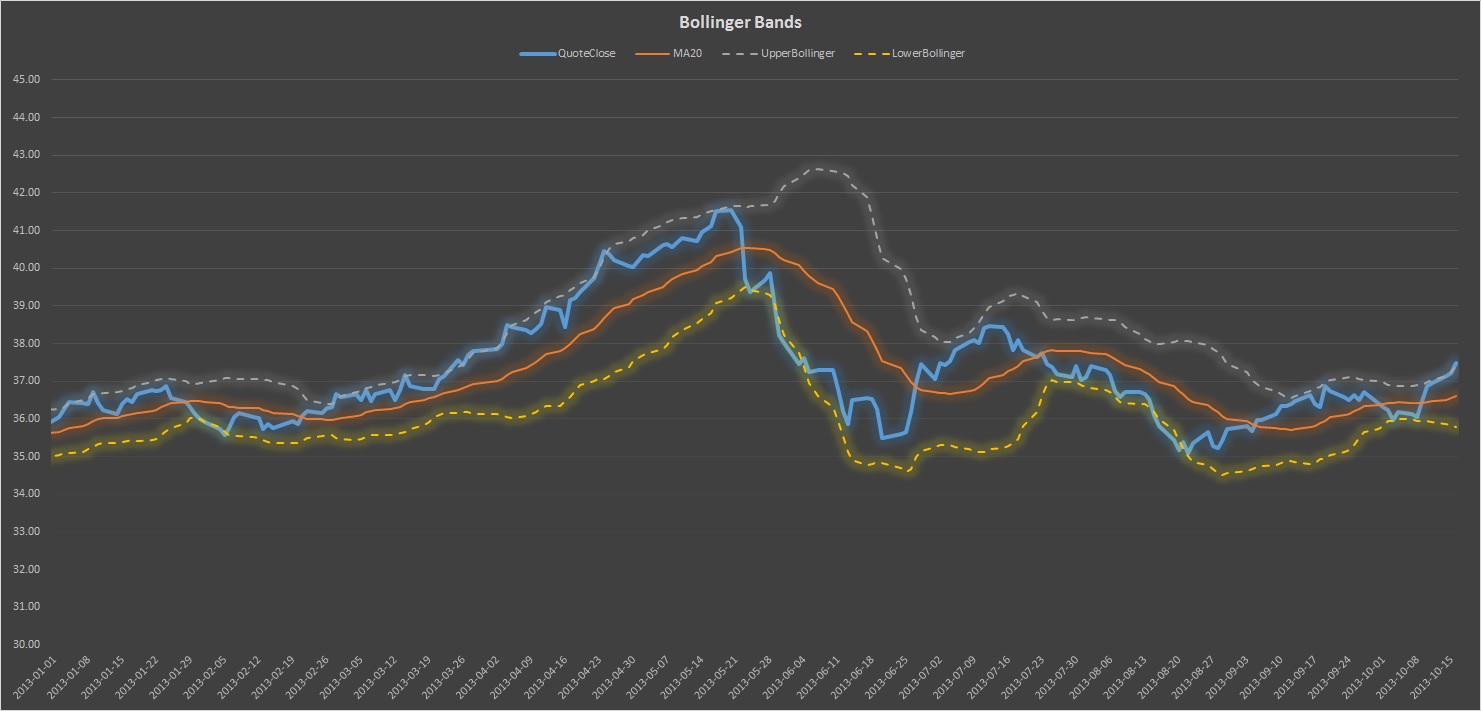
As you can see, the stock price (blue) tends to move within the bands.
[blue_box]This blog post is part of a serie about technical analysis, TA, in SQL Server. See the other posts here.[/blue_box]