sp_describe_first_result_set
The system stored procedure sp_describe_first_result_set was introduced in SQL Server 2012 and it returns meta data about the first submitted T-SQL statement.
The system stored procedure sp_describe_first_result_set was introduced in SQL Server 2012 and it returns meta data about the first submitted T-SQL statement.
I was configuring SSRS (SQL Server Reporting Services) to run locally on my new developement machine, and I ran into some problems that I haven’t encountered before. No matter the configuration settings, in Internet Explorer when I tried to open the Report Manager I kept getting the error:
The underlying connection was closed: An unexpected error occurred on a send.
In the SSRS log file (my logfile was found in the folder “C:\Program Files\Microsoft SQL Server\MSRS11.SS2012\Reporting Services\LogFiles”), the following error was found:
System.Net.WebException: The underlying connection was closed: An unexpected error occurred on a send. —> System.IO.IOException: Unable to read data from the transport connection: An existing connection was forcibly closed by the remote host. —> System.Net.Sockets.SocketException: An existing connection was forcibly closed by the remote host.
SQL Server Data Tools, SSDT, is a plugin to Visual Studio 2010 and later, with the purpose of enabling an integrated development environment, including database development in Visual Studio.
In this blog post I’ll present a introduction to SQL Server Data Tools – SSDT, and it’s major features.
Bollinger Bands® is a technical analysis tool trademarked by its inventor, John Bollinger. The basis for the bands is a simple moving average (SMA). Standard deviation lines are calculated above and under this moving average. Those lines are the Bollinger Bands.
The bands illustrate volatility, since they move apart when there are large movments (volatility) in a stock price, and they move together when there are small movements. The stock price movements within these bands are then used as indicators in trading.
This blog post will show how to calculate Bollinger Bands in T-SQL. This calculation will only work on SQL Server 2012 and later.
The relative strength index (RSI) is a calculation in TA (Technical Analysis) which measures the strength in the direction of the momentum of a stock. It compares losses to gains in closing prices under a decided time period. The measure varies between 0 and 100. 100 means there are only gains in closing prices, and 0 means there are only losses.
In theory, a stock that is rises above a certain RSI threshold, normally 70, can be considered overbought and may be a selling candidate. That is because a reversal can be expected sooner or later when a stock is overbought. Conversely, a stock that sinks below 30 in RSI can be considered oversold and may be a candidate for buying.
This blog post will show how to calculate Relative Strength Index RSI in T-SQL. It will use a time period of 14 periods. The calculation works on all versions of SQL Server.
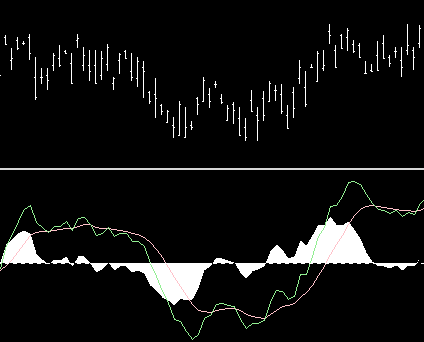
The MACD (Moving Average Converenge Divergence) is a calculation in technical analysis used as a indicator of strength in a trend, or momentum in a stocks closing prices. The calculation uses different lengths of EMA (I covered the calculation of EMA in an earlier blog post here).
The MACD calculation uses the difference between a long EMA and a short EMA to create a oscillator (usually EMA12 – EMA26). The term Moving Average Converenge Divergence comes from the converging and divergence of these two moving averages. When the two moves towards each other there is convergence, and when they move away from each other, there is divergence. A divergence is commonly interpreted as a sign that the current trend is ending.
The MACD also moves around a zero line and when the MACD is above the zero line, that is used as a indicator of upward momentum (higher closing prices) since the short term EMA is above the long term EMA. And of course, if MACD is below the zero line this is an indicator of downward momentum.

Further, a EMA9 is calculated for the MACD. This line is called the “Signal line”. The signal line is used in a trigger for buy and sell signals. More specifically, traders look for crossovers of the two lines. When the MACD moves over the MACD:EMA9, this is a buy signal since it indicates a upward momentum (a bullish market) of the closing prices. And when the MACD crosses under the MACD:EMA9, this is a sell signal since this is a indicator of downward momentum (bearish market).
This blog post will show how to calculate MACD in T-SQL. It works on all versions of SQL Server.