The MACD (Moving Average Converenge Divergence) is a calculation in technical analysis used as a indicator of strength in a trend, or momentum in a stocks closing prices. The calculation uses different lengths of EMA (I covered the calculation of EMA in an earlier blog post here).
The MACD calculation uses the difference between a long EMA and a short EMA to create a oscillator (usually EMA12 – EMA26). The term Moving Average Converenge Divergence comes from the converging and divergence of these two moving averages. When the two moves towards each other there is convergence, and when they move away from each other, there is divergence. A divergence is commonly interpreted as a sign that the current trend is ending.
The MACD also moves around a zero line and when the MACD is above the zero line, that is used as a indicator of upward momentum (higher closing prices) since the short term EMA is above the long term EMA. And of course, if MACD is below the zero line this is an indicator of downward momentum.

White histogram is the difference between the two.
Further, a EMA9 is calculated for the MACD. This line is called the “Signal line”. The signal line is used in a trigger for buy and sell signals. More specifically, traders look for crossovers of the two lines. When the MACD moves over the MACD:EMA9, this is a buy signal since it indicates a upward momentum (a bullish market) of the closing prices. And when the MACD crosses under the MACD:EMA9, this is a sell signal since this is a indicator of downward momentum (bearish market).
This blog post will show how to calculate MACD in T-SQL. It works on all versions of SQL Server.
The examples use the database TAdb. A script to create TAdb can be found here.
Using a extended version of the EMA calculation, the T-SQL below calculates EMA12, EMA26 and MACD:
IF OBJECT_ID('tempdb..#TBL_EMA_LOOP') IS NOT NULL BEGIN
	DROP TABLE #TBL_EMA_LOOP
END

SELECT *, CAST(NULL AS FLOAT) AS EMA12, CAST(NULL AS FLOAT) AS EMA26 INTO #TBL_EMA_LOOP FROM dbo.Quotes

CREATE UNIQUE CLUSTERED INDEX EMA_IDX ON #TBL_EMA_LOOP (StockId, QuoteId)

DECLARE @StockId INT = 1, @QuoteId INT, @QuoteIdMax INT, @StartAvgEMA12 FLOAT, @StartAvgEMA26 FLOAT, @C_EMA12 FLOAT = 2.0 / (1 + 12), @C_EMA26 FLOAT = 2.0 / (1 + 26), @EMA12 FLOAT, @EMA26 FLOAT

WHILE @StockId <= 2 BEGIN
	SELECT @QuoteId = 1, @QuoteIdMax = MAX(QuoteId) FROM dbo.Quotes WHERE StockId = @StockId
	SELECT @StartAvgEMA12 = AVG(QuoteClose) FROM dbo.Quotes WHERE StockId = @StockId AND QuoteId <= 12
	SELECT @StartAvgEMA26 = AVG(QuoteClose) FROM dbo.Quotes WHERE StockId = @StockId AND QuoteId <= 26

	WHILE @QuoteId <= @QuoteIdMax BEGIN
		UPDATE
			T0
		SET
			EMA12 =
				CASE
					WHEN @QuoteId = 12 THEN @StartAvgEMA12
					WHEN @QuoteId > 12 THEN (T0.QuoteClose * @C_EMA12) + T1.EMA12 * (1.0 - @C_EMA12)
				END
			,EMA26 =
				CASE
					WHEN @QuoteId = 26 THEN @StartAvgEMA26
					WHEN @QuoteId > 26 THEN (T0.QuoteClose * @C_EMA26) + T1.EMA26 * (1.0 - @C_EMA26)
				END
		FROM
			#TBL_EMA_LOOP T0
		JOIN
			#TBL_EMA_LOOP T1
		ON
			T0.StockId = T1.StockId
		AND
			T0.QuoteId - 1 = T1.QuoteId
		WHERE
			T0.StockId = @StockId
		AND
			T0.QuoteId = @QuoteId

		SELECT @QuoteId = @QuoteId + 1
	END

	SELECT @StockId = @StockId + 1
END

SELECT
	StockId
	,QuoteId
	,QuoteDay
	,QuoteClose
	,CAST(EMA12 AS NUMERIC(10,2)) AS EMA12
	,CAST(EMA26 AS NUMERIC(10,2)) AS EMA26
	,CAST(EMA12 - EMA26 AS NUMERIC(10,2)) AS MACD
FROM
	#TBL_EMA_LOOP
A sample of the results look like this:
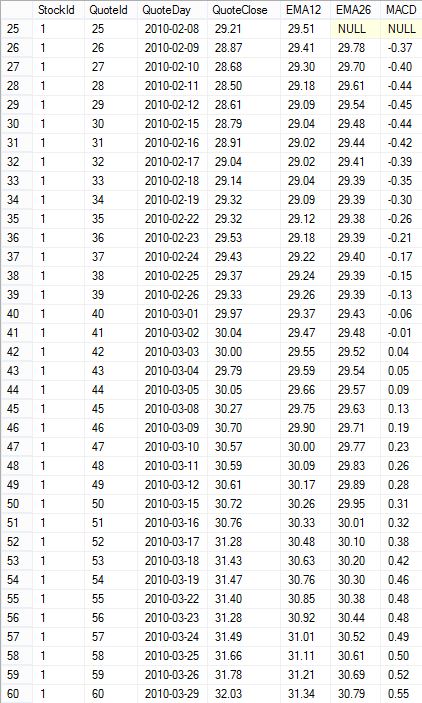
In this example, following the theory stated above, the stock is in a negative momentum (bearish market) up until 2010-03-03 when a crossover occurs and the stock enters a positive momentum (bullish market). And indeed, the stock price rises between 2010-03-03 and 2010-03-29. (If you do the query yourself you will see that the positive momentum lasts up until 2010-05-20 ending at a closing price of 31.78.)
[blue_box]This blog post is part of a serie about technical analysis, TA, in SQL Server. See the other posts here.[/blue_box]

At the moment I can only complemeny you and you work. Genius!!!
I tested your calculation….it’s perfect. Your amazing. I’ve been searching for 3 days now. I must repeat. GENIUS.
Thanks, glad to hear it is working!
Pingback: Exponential moving average in T-SQL | Tomas LindTomas Lind
Hey – just wanted to say thank you for keeping this up and up to date with sql server 2012 — personally i am working on 2008 so i REALY appreciate the nod at older RDBMS’
using this and a few others I can figure out how to implement the other technical indicators I need to write.
Thank you and please keep this archive alive
Thanks, Felix!
Hi ..
i’m trying to find stochastic(%K,%D) script
can you help me ?
Thanks in advance
Hi, I haven’t done that calculation in T-SQL. Can’t remember seeing it anywhere either…
Hi Shahram, this seems to work for calculating a 14 day Stochastic with 3 day and 5 day moving averages:
/*
Calculate Stochastic Oscillator
%K = (Current Close – Lowest Low)/(Highest High – Lowest Low) * 100
%D = 3-day SMA of %K
Lowest Low = lowest low for the look-back period
Highest High = highest high for the look-back period
%K is multiplied by 100 to move the decimal point two places
Fast Stochastic Oscillator:
– Fast %K = %K basic calculation
– Fast %D = 3-period SMA of Fast %K
Slow Stochastic Oscillator:
– Slow %K = Fast %K smoothed with 3-period SMA
– Slow %D = 3-period SMA of Slow %K
*/
USE StockMarket
GO
IF OBJECT_ID(‘StockMarket.dbo.usp_CalculateStochastic’) IS NOT NULL BEGIN
DROP PROCEDURE dbo.usp_CalculateStochastic
END
GO
CREATE PROCEDURE dbo.usp_CalculateStochastic
AS
SET NOCOUNT ON
SET ANSI_WARNINGS OFF
BEGIN
IF OBJECT_ID(‘tempdb..#Stoch’) IS NOT NULL BEGIN
DROP TABLE #Stoch
END
/* Create Temp Table */
SELECT *,
CAST(NULL AS FLOAT) AS HighestHigh14,
CAST(NULL AS FLOAT) AS LowestLow14,
CAST(NULL AS FLOAT) AS StochFast14,
CAST(NULL AS FLOAT) AS SMAFast3,
CAST(NULL AS FLOAT) AS SMAFast5,
CAST(NULL AS FLOAT) AS StochSlow14,
CAST(NULL AS FLOAT) AS SMASlow3,
CAST(NULL AS FLOAT) AS SMASlow5
INTO #Stoch
FROM StockMarket.dbo.HistoricalStockPrices
WHERE MarketDate >= ( GetDate() – 380 )
CREATE UNIQUE CLUSTERED INDEX Stoch_IDX ON #Stoch (Ticker, MarketDate)
DECLARE @Ticker VARCHAR(5),
@MarketDate DateTime,
@MarketDateMin DateTime,
@MarketDateMax DateTime,
@HighestHigh14 FLOAT,
@LowestLow14 FLOAT
/* Set first ticker */
SELECT @Ticker = ( SELECT TOP 1 Ticker
FROM #Stoch h
ORDER BY h.Ticker )
WHILE @Ticker <= 'ZX'
BEGIN
SELECT @MarketDate = MIN(MarketDate),
@MarketDateMin = MIN(MarketDate),
@MarketDateMax = MAX(MarketDate)
FROM #Stoch
WHERE Ticker = @Ticker
WHILE @MarketDate <= @MarketDateMax
BEGIN
/* Get Highest Highs and Lowest Lows */
SELECT @HighestHigh14 = Max(HighPrice),
@LowestLow14 = MIN(LowPrice)
FROM ( SELECT TOP 14
MarketDate,
HighPrice,
LowPrice
FROM #Stoch
WHERE Ticker = @Ticker
AND MarketDate <= @MarketDate
ORDER BY MarketDate DESC ) vt
/* Need to update Stoch Fast 14 first as other other calculations are dependend upon it */
UPDATE s
SET HighestHigh14 = @HighestHigh14,
LowestLow14 = @LowestLow14,
/* (Current Close – Lowest Low)/(Highest High – Lowest Low) * 100 */
StochFast14 = CASE WHEN ( @HighestHigh14 – @LowestLow14 ) = 0
THEN ( ( s.ClosePrice – @LowestLow14 ) / ( .01 ) ) * 100 /* Setting to .01 cent to avoid divide by zero error */
ELSE ( ( s.ClosePrice – @LowestLow14 ) / ( @HighestHigh14 – @LowestLow14 ) ) * 100 END
FROM #Stoch s
WHERE s.Ticker = @Ticker
AND s.MarketDate = @MarketDate
/* Update values based on Stoch Fast 14 */
UPDATE s
SET /* 3-period SMA of Fast Stoch */
SMAFast3 = (SELECT Avg(StochFast14)
FROM ( SELECT TOP 3
MarketDate,
StochFast14
FROM #Stoch
WHERE Ticker = @Ticker
AND MarketDate <= @MarketDate
ORDER BY MarketDate DESC ) vt ),
/* 5-period SMA of Fast Stoch */
SMAFast5 = (SELECT Avg(StochFast14)
FROM ( SELECT TOP 5
MarketDate,
StochFast14
FROM #Stoch
WHERE Ticker = @Ticker
AND MarketDate <= @MarketDate
ORDER BY MarketDate DESC ) vt ),
/* Fast Stoch smoothed with 3-period SMA */
StochSlow14 = ( SELECT Avg(StochFast14)
FROM ( SELECT TOP 3
MarketDate,
StochFast14
FROM #Stoch
WHERE Ticker = @Ticker
AND MarketDate <= @MarketDate
ORDER BY MarketDate DESC ) vt )
FROM #Stoch s
WHERE s.Ticker = @Ticker
AND s.MarketDate = @MarketDate
/* Update values based on Stoch Slow 14 */
UPDATE s
SET /* 3-period SMA of Slow Stoch */
SMASlow3 = (SELECT Avg(StochSlow14)
FROM ( SELECT TOP 3
MarketDate,
StochSlow14
FROM #Stoch
WHERE Ticker = @Ticker
AND MarketDate <= @MarketDate
ORDER BY MarketDate DESC ) vt ),
/* 5-period SMA of Slow Stoch */
SMASlow5 = (SELECT Avg(StochSlow14)
FROM ( SELECT TOP 5
MarketDate,
StochSlow14
FROM #Stoch
WHERE Ticker = @Ticker
AND MarketDate @MarketDate
ORDER BY h.MarketDate )
END
SELECT @Ticker = ( SELECT TOP 1 Ticker
FROM #Stoch h
WHERE h.Ticker > @Ticker
ORDER BY h.Ticker )
END
/* Truncate Stochastic Table */
TRUNCATE TABLE StockMarket.dbo.Stochastic
/* Populate Stochastic Table */
INSERT INTO StockMarket.dbo.Stochastic
SELECT Ticker
,MarketDate
,HighPrice
,LowPrice
,ClosePrice
,CAST(HighestHigh14 AS NUMERIC(10,2)) AS HighestHigh14
,CAST(LowestLow14 AS NUMERIC(10,2)) AS LowestLow14
,CAST(StochFast14 AS NUMERIC(10,2)) AS StochFast14
,CAST(SMAFast3 AS NUMERIC(10,2)) AS SMAFast3
,CAST(SMAFast5 AS NUMERIC(10,2)) AS SMAFast5
,CAST(StochSlow14 AS NUMERIC(10,2)) AS StochSlow14
,CAST(SMASlow3 AS NUMERIC(10,2)) AS SMASlow3
,CAST(SMASlow5 AS NUMERIC(10,2)) AS SMASlow5
FROM #Stoch
ORDER BY Ticker, MarketDate
END;
These scripts are great, thank you for your efforts! Have you ever implemented one for SAR?
Thanks you are amazing, Is it possible to find divergence in MACD ?
Hello
i want to calculate MACD FOR ALL SYMBOL
CAN U HELP ME