A common calculation in trend analysis is the moving (or rolling) average. A moving average is the average of the, for instance, last 10 rows. The moving average shows a more smooth curve than the actual values, more so with a longer period for the moving average, making it an good tool for trend analysis. This blog post will show how to calculate moving average in T-SQL. Different methods will be used depending on the version of SQL Server.
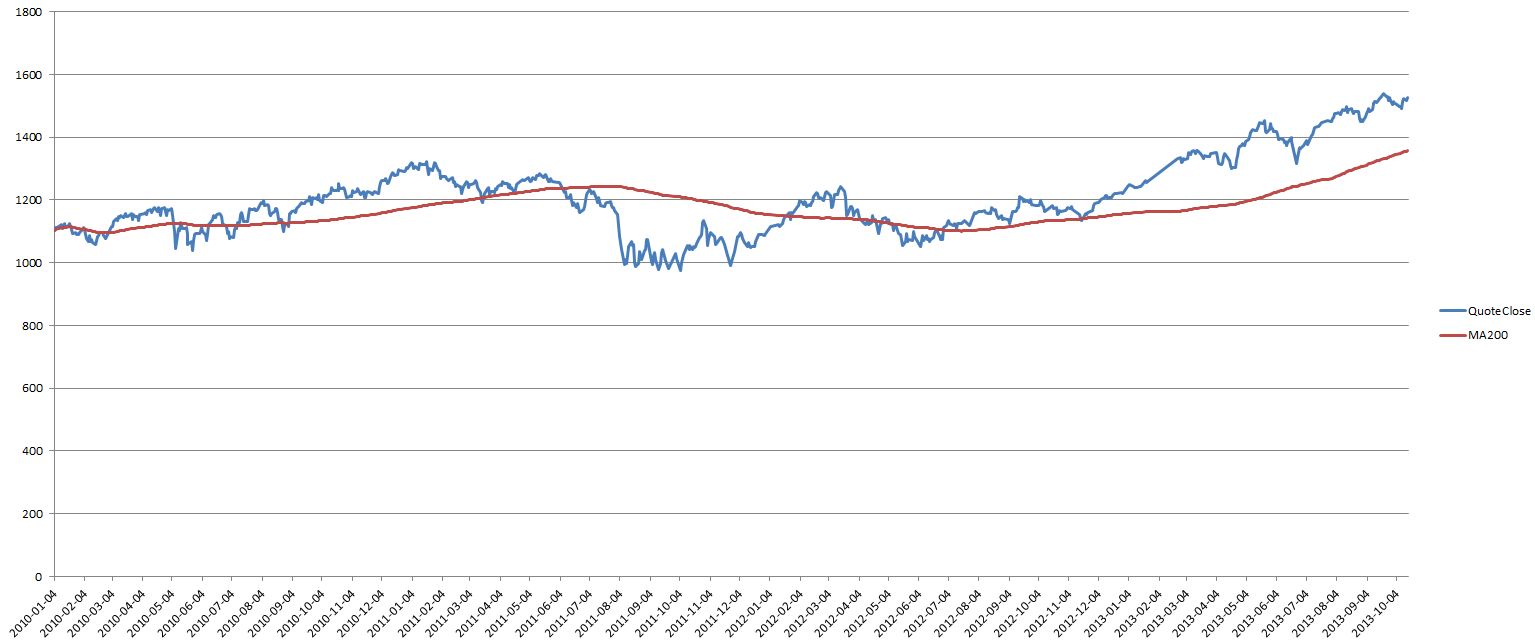
The chart below demonstrates the smoothing effect (red line) with an 200 days moving average. The stock quotes are the blue line. The long term trend is clearly visible.
The demonstration below requires the TAdb database that can be created with the script located here.
In the upcoming example we will calculate a moving average for the last 20 days. Depending of the version of SQL Server, there will be a different method to do the calculation. And, as we will see later, the newer versions of SQL Server has functions enabling a lot more effective calculation.
SQL Server 2012 and later Moving Average
This version make use of a aggregate window function. Whats new in SQL 2012 is the possibility to restrict the size of the window by specifying how many rows preceding the window should contain:
SELECT
	T0.StockId
	,T0.QuoteId
	,T0.QuoteDay
	,T0.QuoteClose
	,AVG(T0.QuoteClose) OVER (PARTITION BY T0.StockId ORDER BY T0.QuoteId ROWS 19 PRECEDING) AS MA20
FROM
	dbo.Quotes AS T0
Rows preceding is 19, because we will include the current row as well in the calculation. As you can see, the calculation of moving average in SQL Server 2012 is pretty simple.
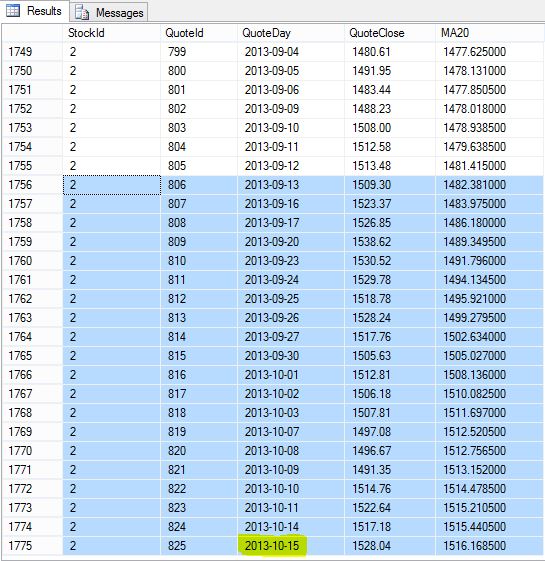
The figure below demonstrates the windowing principle. Current row is marked with yellow. The window is marked with an blue background. The moving average is simply the average of QuoteClose in the blue lines:
The results of the calculations in older versions of SQL Server are the same, so they will not be shown again.
SQL Server 2005 – 2008R2 Moving Average
This version make use of a common table expression. The CTE is self referenced to get the last 20 rows for each row:
;WITH CTE_MA AS
	(
		SELECT
			StockId
			,QuoteId
			,QuoteDay
			,QuoteClose
		FROM
			dbo.Quotes
	)
SELECT
	T0.StockId
	,T0.QuoteId
	,T0.QuoteDay
	,AVG(T1.QuoteClose)
FROM
	CTE_MA AS T0
LEFT OUTER JOIN
	CTE_MA AS T1
ON
	T0.StockId = T1.StockId
AND
	T1.QuoteId <= T0.QuoteId
AND
	T1.QuoteId >= T0.QuoteId - 19
GROUP BY
	T0.StockId
	,T0.QuoteId
	,T0.QuoteDay
Moving Average before SQL Server 2005
The pre 2005 version will use a left outer join to the same table to get the last 20 rows. The outer table can be said to contain the window that we want to calculate an average on:
SELECT
	T0.StockId
	,T0.QuoteId
	,T0.QuoteDay
	,T0.QuoteClose
	,AVG(T1.QuoteClose) AS MA20
FROM
	dbo.Quotes AS T0
JOIN
	dbo.Quotes AS T1
ON
	T0.StockId= T1.StockId
AND
	T1.QuoteId <= T0.QuoteId
AND
	T1.QuoteId >= T0.QuoteId - 19
GROUP BY
	T0.StockId
	,T0.QuoteId
	,T0.QuoteDay
	,T0.QuoteClose
Performance Comparision
If we run the three different methods simultaneously and check the resulting execution plan, there is a dramatic difference in performance between the methods:
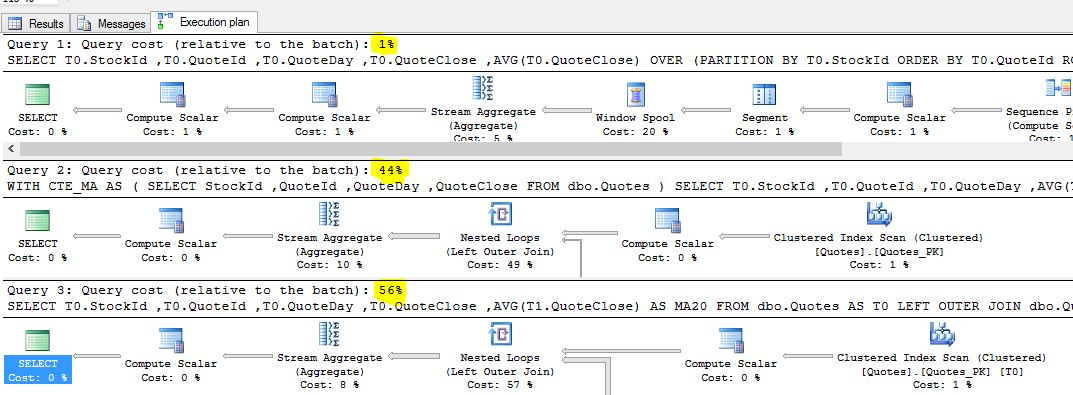
As you can see, the windowing function improvements in SQL 2012 makes a huge difference in performance.
Usage
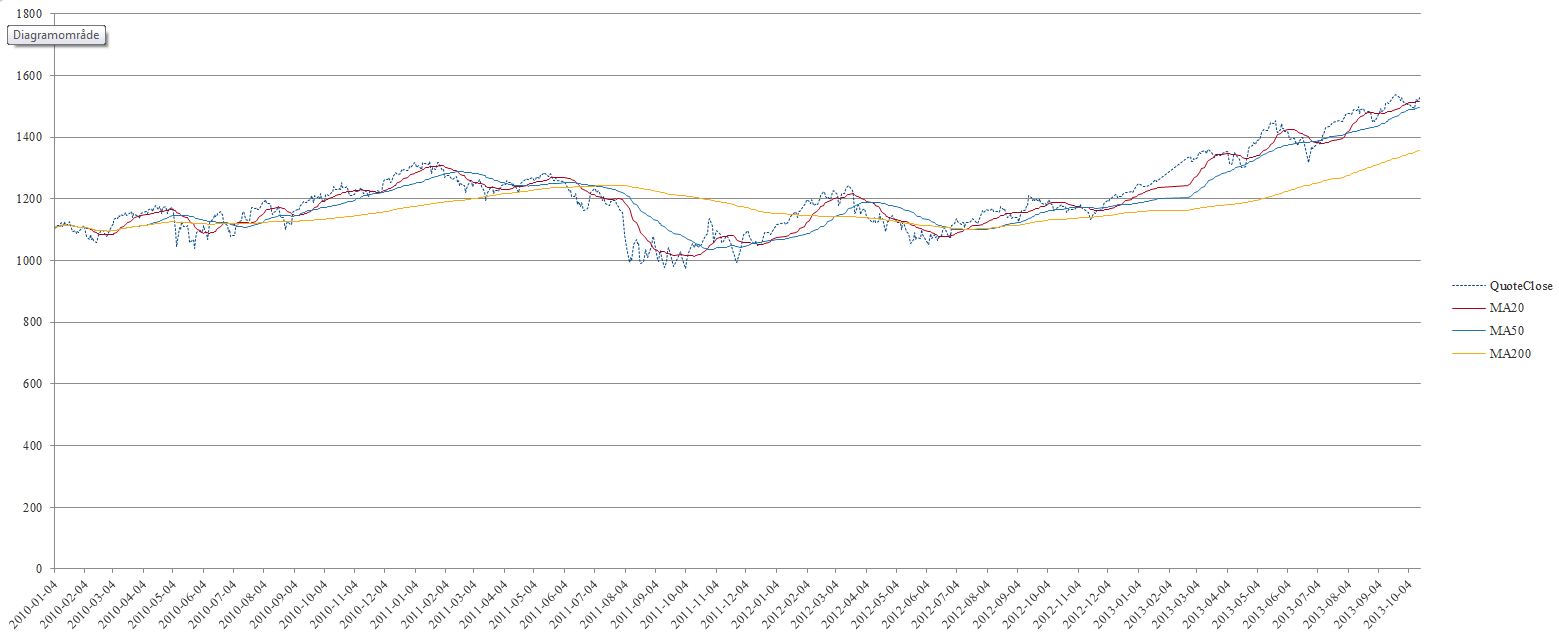
As mentioned in the beginning of this post, moving averages are used as a tool to illustrate trends. A common approach is to combine moving averages of different lengths, in order to spot changes in the short, medium and long term trends respectively. Of particular interest are the crossing of trend lines. For instance, when the short trend moves over the long or medium trend, this can be interpreted as an buy signal in technical analysis. And when the short trend moves under a longer trend line, this can be interpreted as a sell signal.
The chart below shows Quotes, Ma20, Ma50 and Ma200.
[blue_box]This blog post is part of a serie about technical analysis, TA, in SQL Server. See the other posts here.[/blue_box]
Pingback: Exponential moving average in T-SQL | Tomas LindTomas Lind
Excellent, what a weblog it is! This web site gives helpful facts to us, keep it up.
Excellent! Thank you!
Thanks, a lot! You saved my life!
Thanks Erwin! Sometimes there is a lot at stake 🙂
Is there a way to pass a variable for the number of ROWS in the PARTITION clause? So instead of 19 we pass it 50, 200, etc.